Skip to main menu
Febuary 2026 issue
Advising Investors for 36+ Years
January 30, 2026
Gráfico M2 vs GNP
Staying Ahead of the Curve
At the end of January, the so-called Magnificent 7 reported earnings that were good, but not good enough in view of the growth expected by sky-high price earnings ratios averaging 78.5. The reactions were mixed and the group has been flat so far this year. In 2025, the Magnificent 7 -- Nvidia, Apple, Microsoft, Amazon, Alphabet Class A (Google Class A & C), Tesla, Meta Platforms Class A, and Broadcom – did very well and comprised 37.7 percent of the S&P 500 Index because of the heavy capitalization weighting. The S&P 500 Index rose 16.4 percent in 2025, but without the Magnificent 7 it only rose 2.9 percent. Staying Ahead of the Crowd SoundAdvice Advising Investors for 37+ years www.soundadvice-newsletter.com Febuary 2026 Issue January 30, 2026 The Magnificent 7 stocks have been pumped up by the AI boom. There is little doubt that AI is changing the world, but it is prompting billions of capital expenditures into data centers, chips, infrastructure, and AI related equipment. Yet, there is not a clear picture of when and how much of a payout is ahead. If the investment return on the billions these companies are spending does not meet expectations in a timely fashion, the future of these stocks, as well as the S&P 500 Index, is questionable at best. However, that is not the case for the rest of the stock market. Nearly every sector of the economy is already benefiting from AI applications and AI is bound to provide widespread efficiencies. Consequentially, it makes more sense to invest in companies whose earnings will benefit from AI services and whose stocks are reasonably valued. As AI fuels efficiencies and boosts earnings in virtually every industry, the bull market is bound to broaden out. One obvious beneficiary of this trend is the Invesco S&P 500 Equal Weight ETF (RSP)

   The Sound Advice Risk Indicator

Another sign that the S&P 500 Index is inflated is revealed from the Sound Advice Risk Indicator, which compares the Index to house prices for 130 years. The latest reading is 2.51, which puts the S&P 500 Index above the highrisk watermark of 2.0. Our Risk Indicator identifies supercycles, the solemn, inexorable seasons that roll across the market’s landscape; there will be no heat waves in January, no blizzards in July. But in our search for fair winds, we need to know more than the season. We also must be able to predict the shorter-term weather -- the business cycles behind the bull and bear markets that fluctuate along the path of supercycles.

  The Sound Advice Diffusion Indexes

    We rely on the Sound Advice Diffusion Indexes to identify business cycles because they have an accurate track record of predicting major stock market trends for the last 50+ years. They work by observing changes in the most sensitive leading and lagging economic indicators that lead to shifts in interest rates. During “Aggressive” signals over the last 50 years, the S&P 500 climbed an average of 31.5 percent. The market has undergone corrections but has never crashed. All market crashes have occurred during “Caution” signals. When the stock market was not crashing, the S&P 500 either meandered, climbed moderately, or declined in an extended bear market, recording an average decline of 0.6 percent.
   The most recent signal change was in late 2022, when our Diffusion Index of Leading Indicators recorded a zero reading which led to a new signal change from “Caution” to “Aggressive”. That signal was prescient as we began a new bull market.
   The next signal will come from a 100 percent reading of our Diffusion Index of Lagging indicators, revealing that the economy is overheating and exerting upward pressure on inflation and short-term interest rates. It would take a seismic increase in all of the underlying economic indicators contained in our Diffusion Index of Lagging Indicators to cause a 100 percent reading. Accordingly, the end of the current bull market is not on the horizon, and, for the reasons stated above, it should broaden out to benefit more and more stocks that are held by diversified portfolios. 

  The Sound Advice Recomendations

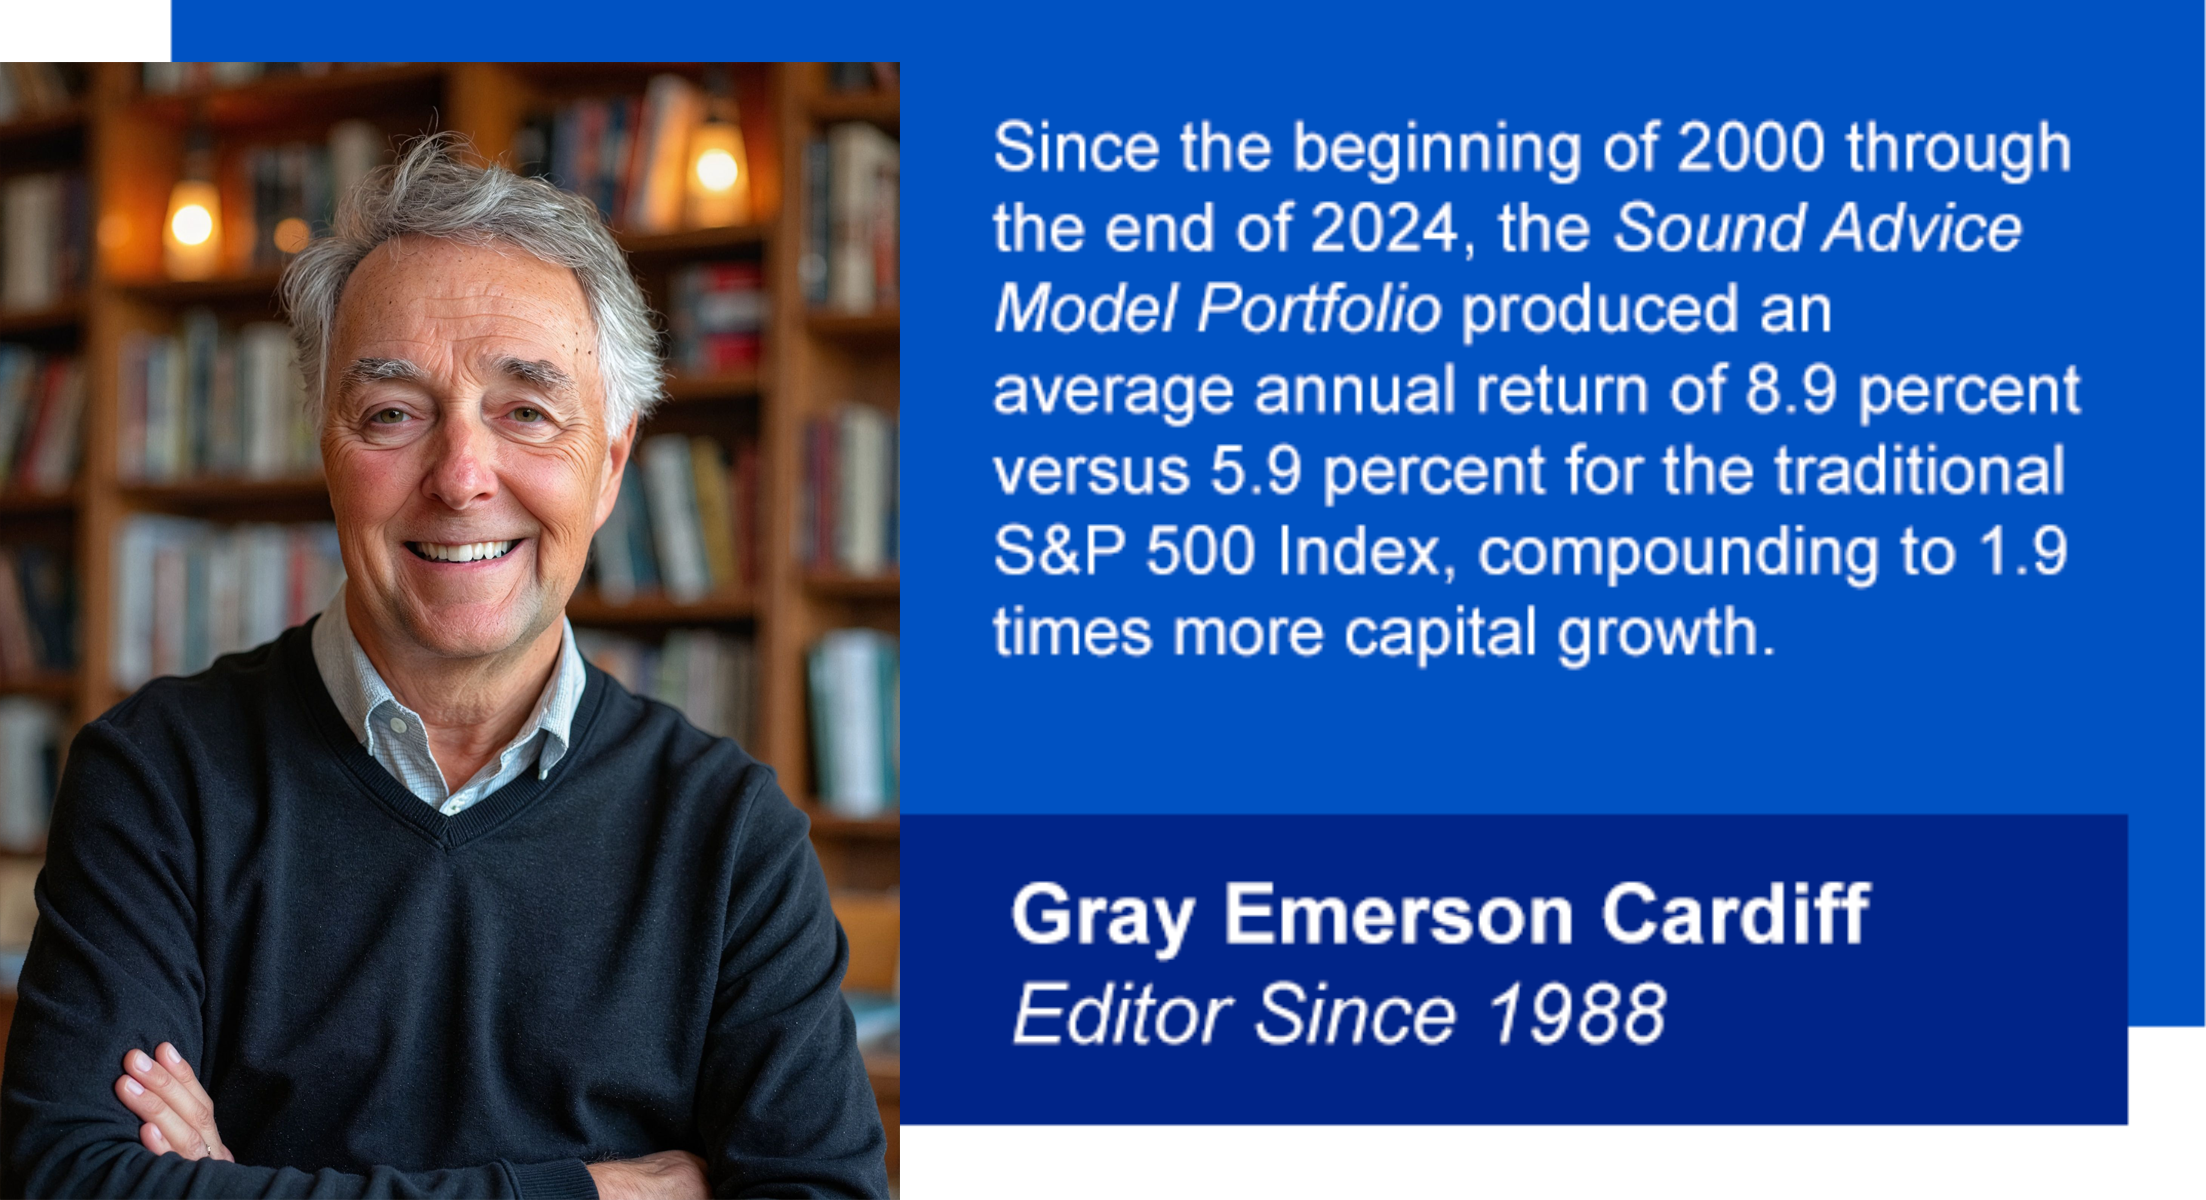
   We eat our own cooking. The Sound Advice Diversified Growth Fund invests exclusively in the Sound Advice Model Portfolio recommendations. The editor of Sound Advice for 36+ years, Gray Cardiff, manages the Sound Advice Fund and is also an investor on a side-by-side basis with the other investors. You can request a prospectus for Sound Advice Fund on the log-in page you used to download this issue of Sound Advice. 
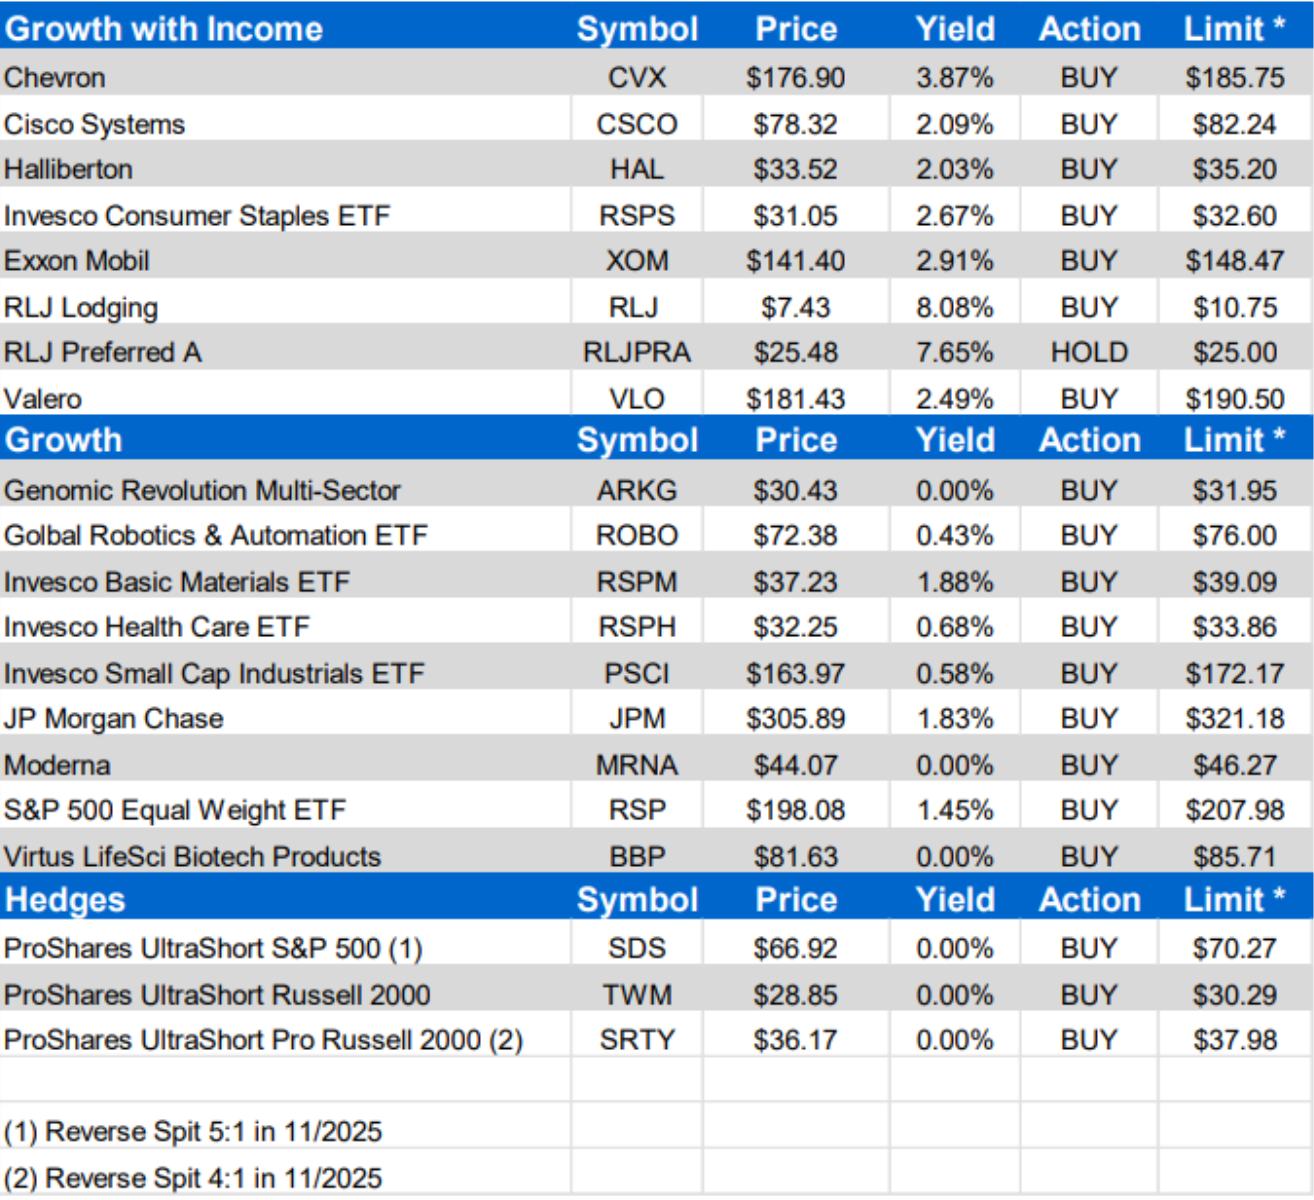
  The Model Portfolio

Our individual stock recommendations are special situations offering a compelling value proposition. We are also recommending liquid electronically traded funds (ETFs) investing in sectors that are bound to benefit in the months and years ahead. All recommendations, as well as their dividend yields and buy/hold/sell recommendations, are summarized in the table and sorted by investment objective categories and then in alphabetical order.

Downside Hedges

We include downside hedges as part of the portfolio to reduce risk and dampen volatility by profiting during market corrections. Minimizing losses, even at the expense of limiting the upside, has been our key strategy for outperforming the market over the long run

ProShares UltraShort S&P 500 (SDS)  is designed to produce two times the daily fluctuations of the traditional S&P 500 Index, only in reverse. For example, a decline of say,1.0 percent in the Index will cause SDS to increase by 2.0 percent. Conversely, an increase in the Index will cause SDS to decline by 2.0 percent. We are including SDS as a hedge because the S&P 500 Index is distorted and inflated, as discussed above. As with any variable, there is a way to gain perspective on what the most likely range will be in the months ahead. It is a basic statistical calculation called the standard deviation, which measures the amount that a variable typically deviates from its average (mean) during a defined period. The high and low boundary within which the variable has moved for 68 percent of the time is statistically defined as one standard deviation, which is deemed to be the most likely range for the future.

Since the depths of the Great Financial Crisis in 2009, the P/E of the S&P 500 Index averaged P/E of 22.4 with a standard deviation of 5.0. This means that the P/E has been within 17.3 to 27.5 for 68 percent of the time. Applying this standard deviation P/E range to on today’s earnings of the S&P 500 Index of $256.35, the future range of the S&P 500 Index puts the range from a low of 4,436 to a high of 7,227. At the average P/E, the S&P 500 Index would be 5,354 which is 17.2 percent lower than today’s closing. Accordingly, here more potential on the downside than the upside. The Russell 2000 Index The Russell Index is comprised of small and mid-sized domestic companies which tend to be more volatile than the overall market, especially during market corrections. The following two ETFs below can also be used as a downside hedge because they short sell the Russell 2000 index. They differ in the leverage employed, which you can choose one according to your investment objectives and risk tolerance.  

ProShares UltraShort Russell2000 (TWM)   is designed to produce two times the daily fluctuations of the Russell 2000 index (IWM). A decline of say,1.0 percent in the Russell 2000 will cause TWM to increase by 2.0 percent. Conversely, an increase in the Russell 2000 will cause TWM to decline in the same fashion.

ProShares UltraShort Pro Russell2000 (SRTY)  is designed to produce three times the daily fluctuations of the Russell 2000 index.

Special Situations
The following stocks are individual companies presenting extraordinary values within their respective industries. Here they are in alphabetical order:

Cisco Systems (CSCO)  is a value play in the AI boom because it supplies the backbone of data center networking equipment and software. The upside growth potential is not anticipated by the current stock price, as evidenced by a relatively low P/E and an attractive dividend yield. CSCO is a direct beneficiary of the billions of capital spending slated for data centers and AI related equipment. Cisco’s management is reporting strong AI business growth and is confident that AI will continue to be a driver of growth.

JP Morgan Chase (JPM)   is a good value for what is considered the world’s highest quality banking enterprise with diversified businesses and prudent underwriting policies. Deregulation of the industry will continue to be a substantial benefit to JPM. The Company has a long history of growing dividends. At the recent Goldman conference, JPM said that productivity in operations is improving because of AI programs could be scaled further

Moderna (MRNA)   is a pure investment play on Messenger RNA (mRNA) technology. This revolutionary technology is on a path to provide solutions for not only vaccines, but for cures and treatments for the most deadly and debilitating diseases haunting humanity. Management believes that the company’s cash reserves will be sufficient to sustain the business while it develops vaccines and treatments. After Phase 2 results showed a 75% recurrence free survival rate after three years, the mRNA-4157 cancer vaccine is now in a Phase 3 trial for adjuvant melanoma. In January, the company announced 5-year results from its phase 2b study of this cancer vaccine in melanoma patients of a 49% reduction in the risk of death or recurrence at five years. There are also other promising cancer vaccines in the pipeline including a vaccine for renal call carcinoma. Moderna is working on personal cancer vaccines through the use of analyzing see fragments of cancer cells in a blood draw, allowing the detection of cancer in early stages, before it graduates into more serious later stages. Data will be transmitted through the cloud to Moderna’s IT system, and AI algorithms will be used to compare an individual’s particular cancer cell mutation to the hundreds of thousands of possibilities and to the treatments that are currently effective. Management says Moderna will be able to analyze and develop a treatment customized for an individual patient within 30 days of the blood draw, and over time with more and more data, the process will become more efficient and accurate. 

RLJ Lodging Trust (RLJ)   pays an annual dividend of 60 cents per share is a yield of 7.8 percent, and the dividend is well-covered by the company’s cash flow. This REIT is severely undervalued. RLJ has a large and diversified portfolio of hotel properties, with 96 premium-branded, high-margin, focused-service and compact full-service hotels located in 23 states and Washington DC. This is a low-leveraged REIT because the company’s debt is only 46 percent of its (book value) assets. The portfolio’s net operating income (NOI) for the trailing four quarters was $380 million. Using a conservatively high cap rate of 7.5 percent produces a portfolio value of $5.07 billion. Adding other assets and subtracting liabilities leaves the company equity of $3.09 billion. After subtracting the liquidation value of the company’s only preferred stock of $328 million leaves equity for the common shareholders of $2.76 billion. Dividing that equity by the 149.5 million shares of RLJ outstanding translates to a net asset value of $18.46 per share – more than double the current price of the stock price.

RLJ’s $1.95 Series A Cumulative Convertible Preferred (RLJPRA)   is RLJ’s only preferred stock, with a liquidation preference of $25 per share, which is the maximum value that would be received from an acquisition of the company. Use limit orders at $25 or lower to accumulate this preferred stock for a safe annual yield close to 8 percent. The dividends for this preferred only consume 10.2 percent of the company’s cash income and must be paid before common dividends, making the yield highly secure.

Special Situations in Energy
As the US flotilla sailed from Venezuela to Iran at the end of January, Iran warned that it intends to carry out a naval exercise involving live fire in the Strait of Hormuz imminently, one of the world’s most critical oil transit routes used by close to 20% of global oil flows. The price of oil and gas had been on the rise and spiked in the ending days of January. As a result, the prices of our energy holdings have risen sharply. Looking beyond the near-term crisis in Iran, world-wide supplies are adequate, even without Iran’s 3 percent contribution. However, increasing volume coming from the US to the rest of the world will increase revenue for the major US oil companies, even without high energy prices. Energy providers also stand to benefit from the AI boom. Power needs from data centers is expected to double by 2030 after decades of stagnant demand in the US. Our following energy selections present stellar values for long-term profits with currently attractive and potentially increasing already attractive dividend income.

Chevron (CVX)   reported earnings at the end of January that beat expectations on both gross revenue and earnings. has a long history of dividend increases. Future dividend increases are bound to be supported by production growth from assets in the Permian Basin. The acquisition of Hess Corporation (HES) in July 2025 gave the company a 30% share in the Guyana Stabroek block which holds the equivalent of 11 billion barrels with a low production cost. Chevron’s daily production has risen above 4 million barrels. Chevron has a strong balance sheet with low debt, which along with plenty of free cash flow, give it staying power during adverse conditions with the ability to make timely accretive acquisitions. Chevron recently announced that it plans to build its first project to power an AI data center using natural gas in West Texas which is planned to provide 2.5 gigawatts of off-grid power.

Exxon Mobil (XOM)   has low production costs. Production from its immense Guyana field it shares with Chevron is boosting earnings despite lower oil prices and lower refining margins. The benefits are starting to appear from the 2023 acquisition of Pioneer National Resources, evidenced by new production growth in the Permian Basin. XOM also has an attractive dividend yield with a history of dividend increases. The dividend was increased again in 2025 for a solid string of 43 annual dividend increases.
Exxon will certainly participate in developing the massive proven oil reserves that reside in Venezuela because of its experience and expertise in developing oil assets in the region.

Halliburton (HAL)   is a premier oil field services company. With a substantial presence in the US, Halliburton derives a larger share of its revenues from North America than its primary competitors, SLB Inc and Baker Hughes. The world’s easy oil reservoirs have been developed, even in the Middle-East. Now it takes more sophisticated equipment and technology, which is what Haliburton provides. That trend puts HAL on a growth path. Halliburton has technological innovations that are tailor made for the unconventional reservoirs in the US, including its directional drilling system, the iCruise CX system, which is a rotary steerable tool and LOGIX drilling automation platform that makes it possible to reliably drill in curves and laterally in a single run. This new technology has been rapidly deployed in the Permian Basin. Other relatively new Halliburton technologies include the Zeus platform, electric pumping units, Octiv Auto Frac, and Sensori subsurface measurement. These systems increase efficiency and replace outdated and costly diesel generators as power sources for onsite drilling with generators capable of using natural gas, LNG, and a variety of other fuels that are available on the drilling site. In Alaska, where some of the nation’s largest oil and gas reserves reside, Halliburton’s EarthStar ultra-deep resistivity tool and reservoir mapping service delivers unmatched performance on the North Slope. Exploring in Alaska was curtailed by the Biden Administration, but that is now expanding under the Trump Administration.

Valero Energy (VLO)  was added to the portfolio several years ago at $60.41 per share. As earnings have grown, VLO is still a bargain with a relatively low P/E and attractive dividend yield. Valero makes its money from the “crack spread”, which is the profit margin derived from purchasing crude oil, turning it into refined products such as gasoline and jet fuel, and selling those refined products. Valero has the unique ability to refine both light crude oil coming from fracking in the US Permian basin as well as the sticky heavy crude coming from Venezuela. Light crude oil is great for refining into gasoline but not much else. Heavy crude is sought by refiners because it refines into many other products at high profit margins, ranging from diesel fuel to asphalt. Access to Venezuelan crude will benefit VLO over the longer term when production there increases. Valero’s ability to refine a variety of crude oil types also gives it the ability to achieve discounts for its crude oil feedstocks. This flexibility and access allow Valero to capture the highest margins among its competitors because it can take advantage of the temporary gluts of crude, whether it’s low or high-quality crude or light sweet (low sulfur) or heavy sour (high sulfur) crude, to obtain the best available discounts for its feedstocks. The company’s refineries also have access to the US pipeline network from its gulf coast locations. Valero’s “green energy” joint venture with Diamond Green Diesel is producing renewable diesel at large profit margins. Renewable diesel is made from animal or plant waste material which reduces greenhouse gas emissions up to 80 percent because it only releases as much carbon dioxide as the material originally contained. Renewable diesel does not congeal at low temperatures which means it can be easily transported through pipelines.

Equal Weight S&P 500 ETF

Invesco S&P 500 Equal Weight ETF (RSP)  invests in all the S&P 500 stocks but on an equally weighted basis and rebalances its portfolio each quarter to maintain its equal weights. This preservation of value is behind the superior performance over the traditional S&P 500 Index over the long-term. This ETF is bound to benefit from the broadening out of the bull market. The Magnificent 7 stocks only represent 2.2 percent of this ETF. In 2025, RSP grew by 9.3 percent. The Magnificent 7 stocks only accounted for 0.7 percentage points of that growth. From the beginning of 2000, RSP has outperformed all the major indexes, with an annual percentage rate (APR) of 6.99%. This compares to the Dow Jones Industrials with an APR of 5.4%; the Russell 2000 with an APR of 5.1%; the Nasdaq Composite with an APR of 6.4%; as well as the traditional S&P 500 Index with an APR of 6.3%. These returns compare to the APR of 8.9% from the Sound Advice recommendations over the same period.

Sector 500 ETFs

Included in the Sound Advice model portfolio are the following electronically traded funds (ETFs) investing in sectors that are bound to benefit in the months and years ahead from fundamental changes in geopolitical, medical, and economic landscapes. These ETFs contain a portfolio of stocks, much like a mutual fund but ETFs are liquid and trade like stocks with their own ticker symbols. Their prices are determined by the value of the portfolio of stocks they hold.  

Artificial Intelligence
Global Robotics and Automation Index ETF (ROBO)  is investing in the key to making the world’s companies more efficient -- robotics and automation. Approximately half of the portfolio is in robotics technologies, and the other half is in the technology controlling the robots – sensing, computing actuation, and artificial intelligence (AI). This is a diversified way of investing in AI which is the next technological frontier and will be playing an increasingly greater role in the way companies operate around the world.

Biotech ETFs
Biotech companies offer explosive profits because they are the source of the world’s top breakthrough vaccines and treatments. Their stocks are often volatile, making diversification essential. This can be accomplished by investing in a diversified electronically traded fund (ETF) investing exclusively in a portfolio of biotech companies.
ARK Genomic Revolution Multi-Sector (ARKG)   is an actively managed biotech ETF investing in companies expected to benefit by incorporating technological and scientific developments, along with advancements stemming from mapping the human genome. Technological breakthroughs in artificial intelligence and other high-tech advancements have cut the cost substantially of opening new opportunities and putting this sector on the cutting edge of many new innovations.

Balanced Sector ETFs
The following ETFs rebalance their holdings quarterly to equalize the values, which offers a greater degree of evenly weighted diversification and adds stability as well as safety to a portfolio. This practice often provides a superior performance because it offers upside from stocks that are often under-weighted in the portfolios of other ETFs and mutual funds.
Virtus LifeSci Biotech Products (BBP)   is a passively managed biotech ETF that weighs the portfolio selections essentially equally, as opposed to the more typical practice of weighing selections according to market capitalization. This is an important aspect because biotech ETFs who weigh their portfolio selections essentially equally have been the best performers because they have larger investments in smaller biotechnology companies which have become acquisition targets for large pharmaceutical companies looking for ways to expand.

Health Care
Health care stocks have several traits that make them desirable long-term investments. They are well-suited for an aging population, which exerts disproportionate demands on the health care industry. As the world’s population continues to age, this trend is inexorable, making the health care sector defensive in nature and more insulated from economic cycles than other sectors. Health care companies are also prime candidates for new AI technologies that are bound to improve efficiency and accelerate growth.
One of the main criticisms of most health care ETFs is that they are dominated by a relatively small number of large companies, such as Johnson & Johnson, which distort the performance of the typical health care ETF portfolio.
Invesco’s S&P 500 Equal Weight Health Care ETF (RSPH)   tracks the S&P 500 Equal Weight Health Care Index, which tracks 65 health care stocks represented in the S&P 500, but weights each holding evenly. Both the Index and RSPH are rebalanced quarterly. This approach has given RSPH a superior performance to the large health care ETFs.

Consumer Staples
Invesco S&P 500 Equal Weight Consumer Staples ETF (RSPS)    invests in consumer staple stocks within the S&P 500 Index. Consumer staples are those unexciting products we use every day without much thought, ranging from food, beverages (including alcohol), household goods (including cleaning supplies), and hygiene products. These are products that people are unable (or unwilling) to remove from their budgets regardless of their financial situation. The nature of these products makes this sector defensive and much less vulnerable to periods of soft or negative economic growth.  

Tariffs & US Manufacturing
Tariffs are aimed at incentivizing production inside the US because teriffs can be avoided by moving production is within US, even if by international companies. Looking beyond the near term, the companies in the following ETFs are bound to be direct beneficiaries of increased capital expenditures for US production facilities. Since the announcement of tariffs, a long list of companies have announced trillions of dollars of immediate capital investments for production facilities inside the US, including: $500 billion from Apple; $500 billion from Project Stargate led by Japan-based Softbank and U.S.-based OpenAI and Oracle; $100 billion from Taiwan Semiconductor Manufacturing Company (TSMC); $20 billion from Eli Lilly; $20 billion from United Arab Emirates-based DAMAC Properties; $20 billion from France-based shipping giant CMA CGM; $20 billion from Hyundai which includes $5.8 billion for a new steel plant. The list goes on including substantial investments from all of the world’s major automobile manufacturers along with scores of international companies in other major and supporting industries.
Invesco S&P SmallCap Industrials ETF (PSCI)    is based on the S&P SmallCap 600 Capped Industrials Index which is designed to measure the overall performance of the securities of US industrial companies with small capitalizations (caps). These domestic companies are engaged in the business of providing domestic industrial products and services, including engineering, heavy machinery, construction, electrical equipment, aerospace, and defense, as well as general manufacturing. They will reflect the positive impacts more strongly than larger companies from an increase in domestic capital spending. Small cap construction companies typically operate inside the US on local construction projects that tend to employ local companies as subcontractors, even when general contractors may be national companies.

Invesco S&P 500 Equal Weight Materials ETF (RSPM)   invests in the companies that comprise the S&P 500 Equal Weight Materials Index. The portfolio contains prime examples of basic materials companies outside of the oil and gas industries. Increased capital expenditures on new US production facilities will translate into demand for basic materials.

Portfolio Summary Table 

* Note to the table:
The right hand column is the highest recommended price limit for purchases.

General Comments: Our statistics are based on the assumption that $10,000 is invested in each position. When a new position is added, we assume the same $10,000 amount is invested in the new recommendation. When we recommend adding to a particular position, as we have done over the years, we assume another $10,000 is invested again in that position. If you are picking and choosing, you can focus on the sector of the portfolio that matches your investment objectives. Alternatively, you may have a higher degree of comfort with certain industries, funds, or stocks because of past experience or your profession. In that case, you may want to invest more heavily in one sector, or in one or more individual recommendations. As always, broad diversification will temper volatility, add to safety, and improve long-term performance.
Sound Advice versus the S&P 500 

Investment Performance Comparision

Growth of $100,000 invested in 2000

This chart shows the growth Of $100,000 invested In the S&P 500 (In gray) since 2000 would have grown to $400,231, versus $772,409 if it was invested in the Sound Advice recommendations (in blue) for 2.4 times more capital.

Business Cycles and Stocks:
The SoundAdvice Diffusion Indexes
Track record of the
SoundAdvice Diffusion Indexes
Druning the last 49+years, after each “Aggressive” signal, the S&P 500 climbed an average of 31.5 percent. During “Caution” signals, the S&P 500 either crashed, meandered, or climbed, recording an average decrease of 0.6 percent.
Signal Dates (Month-Year)
AggresiveS&P 500CautionS&P 500
Sep-7468.12Apr-76101.9
Jul-76104.20Dec-76104.7
Oct-78100.58Jun-79101.7
Nov-79104.08Oct-83167.7
Aug-84164.48Jun-85188.9
Jul-86240.18Apr-87291.7
Feb-88258.13Jun-88270.7
Mar-89288.00Mar-93449.7
Mar-95493.56Oct-981,141.0
Jun-001,429.40Jan-001,410.0
Jun-03974.50May-051,191.5
Jun-061,276.66Mar-071,386.9
Dec-08 (1)865.58Apr-10 (2)1,197.3
Dec-10 (3)1,232.00Jun-12 (4)1,359.8
Sep-12 (5)1,437.92Mar-14 (5)1,864.9
Mar-152,079.99May-152,111.9
Sep-172,492.84Feb-182,745.7
Mar-20 (7)2,761.98Nov 21 (8)4,667.4
Dec-223,912.38
Ave +/-31.5%-0.6%
Quantitative Easing (QE) Overriding Signals
(1) QE-1 announced 4 months before Aggressive signal
(2) QE-1 terminated into existing Caution signal
(3) QE-2 announced but already in Aggressive mode
(4) QE-2 terminated into existing Caution signal
(5) QE-3 announced, changed to Aggressive mode
(6) QE-3 terminated into existing Caution signal
(7) QE-4 announced, changed to Aggressive mode
(8) QE-4 terminated into existing Caution signal
The Risk Indicator (page 11) reveals long macro cycles. An analogy can be made to the way radio waves work. Long radio waves have frequencies which are assigned to various radio stations, allowing you to distinguish them on your radio. Riding along the path of these long waves are short waves that produce the sound you actually hear on a particular station. These short waves are like the bull and bear markets revealed by the Diffusion Indexes. 
While the path of the long cycles revealed by the Risk Indicator may be in a certain direction, there are bull and bear markets along the way. Of course, these relatively short bull and bear markets are significant during our investing careers. Even during times when the Sound Advice Risk Indicator is above the “low risk” reading, such as it is now, there have been substantial bull markets. We will rely on our Diffusion Indexes to reveal when that will be.
The data we need is contained in the leading and lagging economic indicators. We have hand picked the most sensitive of these economic indicators to produce our “Diffusion Indexes” which function with amazing accuracy as predictors of the birth of cyclical bull and bear markets.
To construct our Sound Advice Diffusion Indexes, we observe changes in each of our selected indicators over a five-month period, and take the percentage of those increasing.
When the Sound Advice Diffusion Index of LEADING Indicators drops to zero, it is time to buy stocks aggressively, regardless of how negative the atmosphere may be. This is not just an empirical coincidence. It is also logical. When all three the leading economic indicators decline compared to five months earlier, it reveals that the soft economy is providing an atmosphere for declining short-term interest rates.This Diffusion Index gave us a zero reading in December 2008, close to the bottom, officially giving us an “Aggressive” signal. That signal came at a time when the Risk Indicator was below 1.0, which revealed that Supercycle 5 came to an end, and that Supercycle 6 was born.
The Sound Advice Diffusion Index of LAGGING Indicators gives “Caution” signals when all three of its individual lagging economic indicators rise above their respective levels of six months earlier, providing a 100 percent reading. This reading reveals that the US economy is strong enough to put upward pressures on interest rates.
A Powerful Overriding Force
Most of the time, the Diffusion Indexes are excellent detectors of the natural business cycle and a path to the science of making money in the stock market. However, the forces of the natural business cycle can be dominated by extraordinary changes in monetary policy during emergency situations.
The COVID-19 pandemic was the most recent example. In mid-March 2020, the Federal Reserve declared the institution of its fourth “Quantitative Easing” (QE) program whereby it dropped the Federal Funds rate to zero and commenced buying massing amounts of US Treasury bonds. With its mighty power, the Fed drove down interest rates and infused massive amounts of liquidity into the US economy. The money supply mushroomed.
At times like this, we need to ignore readings from the Diffusion Indexes. Interest rates are dropping by the Federal Reserve’s mandate, just as if the Diffusion Index of Leading Indicators had plunged to zero. Conversely, whenever the Federal Reserve declares an end to its QE program, we return to our Diffusion Indexes to follow their readings. If the Diffusion Index has moved to a “Caution” signal during the QE program, we should follow that reading. This is the most likely pattern of events because the economy will likely have strengthened in order for the Federal Reserve to end its QE program.
The impact of the Federal Reserve’s four QE programs on existing Diffusion Index signals are noted in the footnotes under the track record table.
Current Status
Our current “Aggressive” mode was established by a zero reading for the Diffusion Index of LEADING Indicators in December 2022 based on the indicators for November 2022. The latest reading is zero percent, revealing once again that the soft economy is providing an atmosphere for declining short-term interest rates.
Our next signal will be a “Caution” signal from a 100 percent reading on the Diffusion Index of LAGGING Indicators which recorded 33 percent based on the latest indicators.
The 2025 Edition: 
The Science of Making Money in the Stock Market
By Gray Emerson Cardiff
For Kindles, Ipads, and in Paperback
This book that explains all of the SoundAdvice indicators, including the Diffusion Indexes and Risk Indicator, and exactly how they work, along with a detailed history to back up the track records.
Price $7.99 (Free for Kindle Unlimited). Free to share with friends and relatives.
Capital Competition: Real Estate versus Stocks:
The SoundAdvice Risk Indicator
There are few forces that are more important to a market’s destiny than the amount of capital that is available to it. In a normal situation, capital will flow easily between markets as their underlying conditions change. But if a market becomes dangerously superheated, it will absorb a larger proportion of available investment capital than economic conditions and market demand can justify. This change will be reflected not only in the rising market’s prices but also in the prices of competing markets, which will be lower than their underlying fundamentals would indicate they should be. Over the last 120+ years, we can see this titanic struggle between the stock market and its foremost competitor for investment dollars: real estate
To reveal this phenomenon, we have set up an equation based on the ratio of the S&P 500 Stock Index to median price of new houses for each month over the last 100+ years. This equation exhibits an elegant financial minuet as each market has taken turns outperforming the other.
As we look at the historical data, we find that there is a range in which the price disparities are so strong that they are too great to be accounted for by the fundamental economic conditions underlying each market. Every time prices get into these danger zones it has meant that the prices in one market or the other have gone too high, and that they are in imminent danger of falling.
We label this new tool the Sound Advice “Risk Indicator,” since it will allow us to locate the point at which prices are so high when compared to competing markets that they have come loose from their moorings and are on the verge of declining or under performing the other market.
What is too high? When stock prices are very high relative to house prices, the Sound Advice Risk Indicator will rise over the line marked 2.0, revealing a high-risk time for stocks. In contrast, when the indicator drops below the line marked 1.0, it means that it is a very low-risk time to buy stocks. Notice from the chart how the Sound Advice Risk Indicator has oscillated back and forth, revealing the ongoing struggle between stocks and houses for investment capital. We have labeled these long vacillations Supercycles.
Although an investment beginning with $25,000 in1895 could have made money being in either stocks or housing, had an investor followed the signals of the Sound Advice Risk Indicator, he or she would have made $560 million versus $34 million by simply holding stocks through the ups and downs, or 17 times more money.
With the latest median house price at 403,700 in March 2025 (the latest data) and with the S&P 500 averaging 5,811 in May, the Sound Advice Risk Indicator read 3.1.